Stephanie Tabb
AI PRODUCT LEAD + LICENSED ARCHITECT
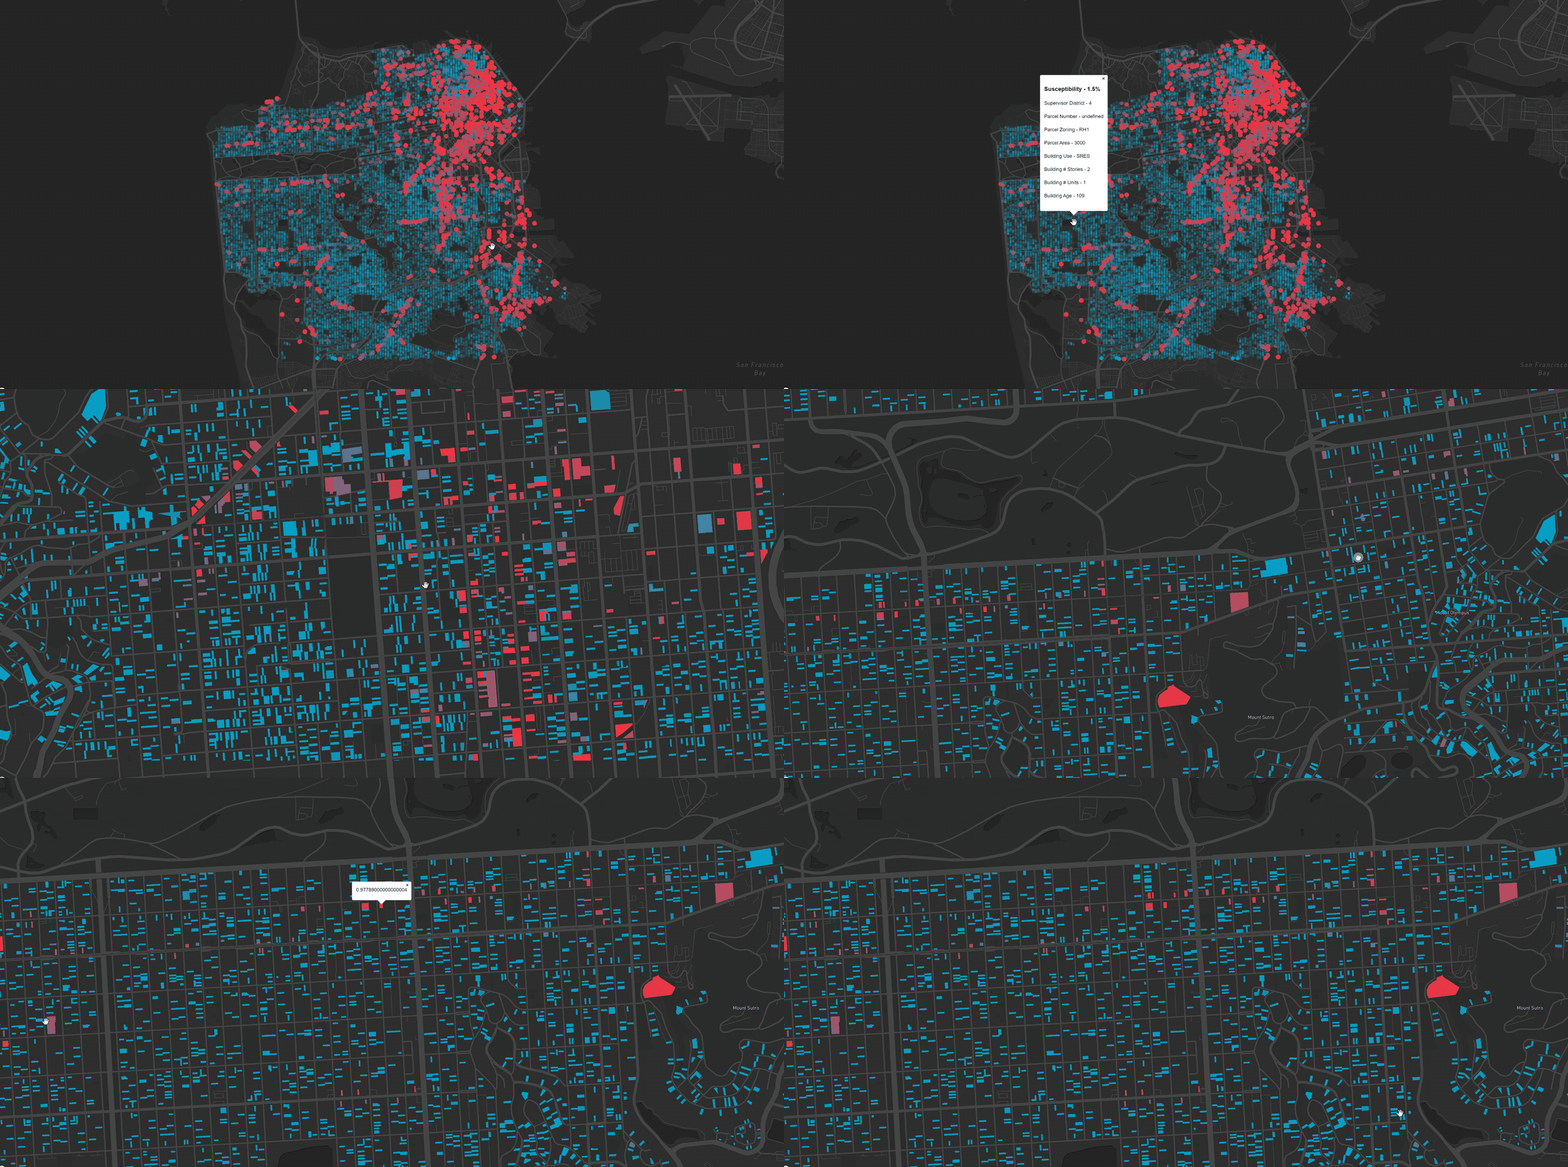
Urban Development Predictor using Machine Learning
How can designers, developers and policymakers leverage machine learning to transform how we understand and shape the urban environment?
Machine learning at an urban scale can help architects and planners diagnose complex issues, uncover the patterns that shape a city, and test interventions before they happen. SOM explored this through its inaugural Year One accelerator program for recent graduates in 2018, focused on the industry’s most complex organism: the city.
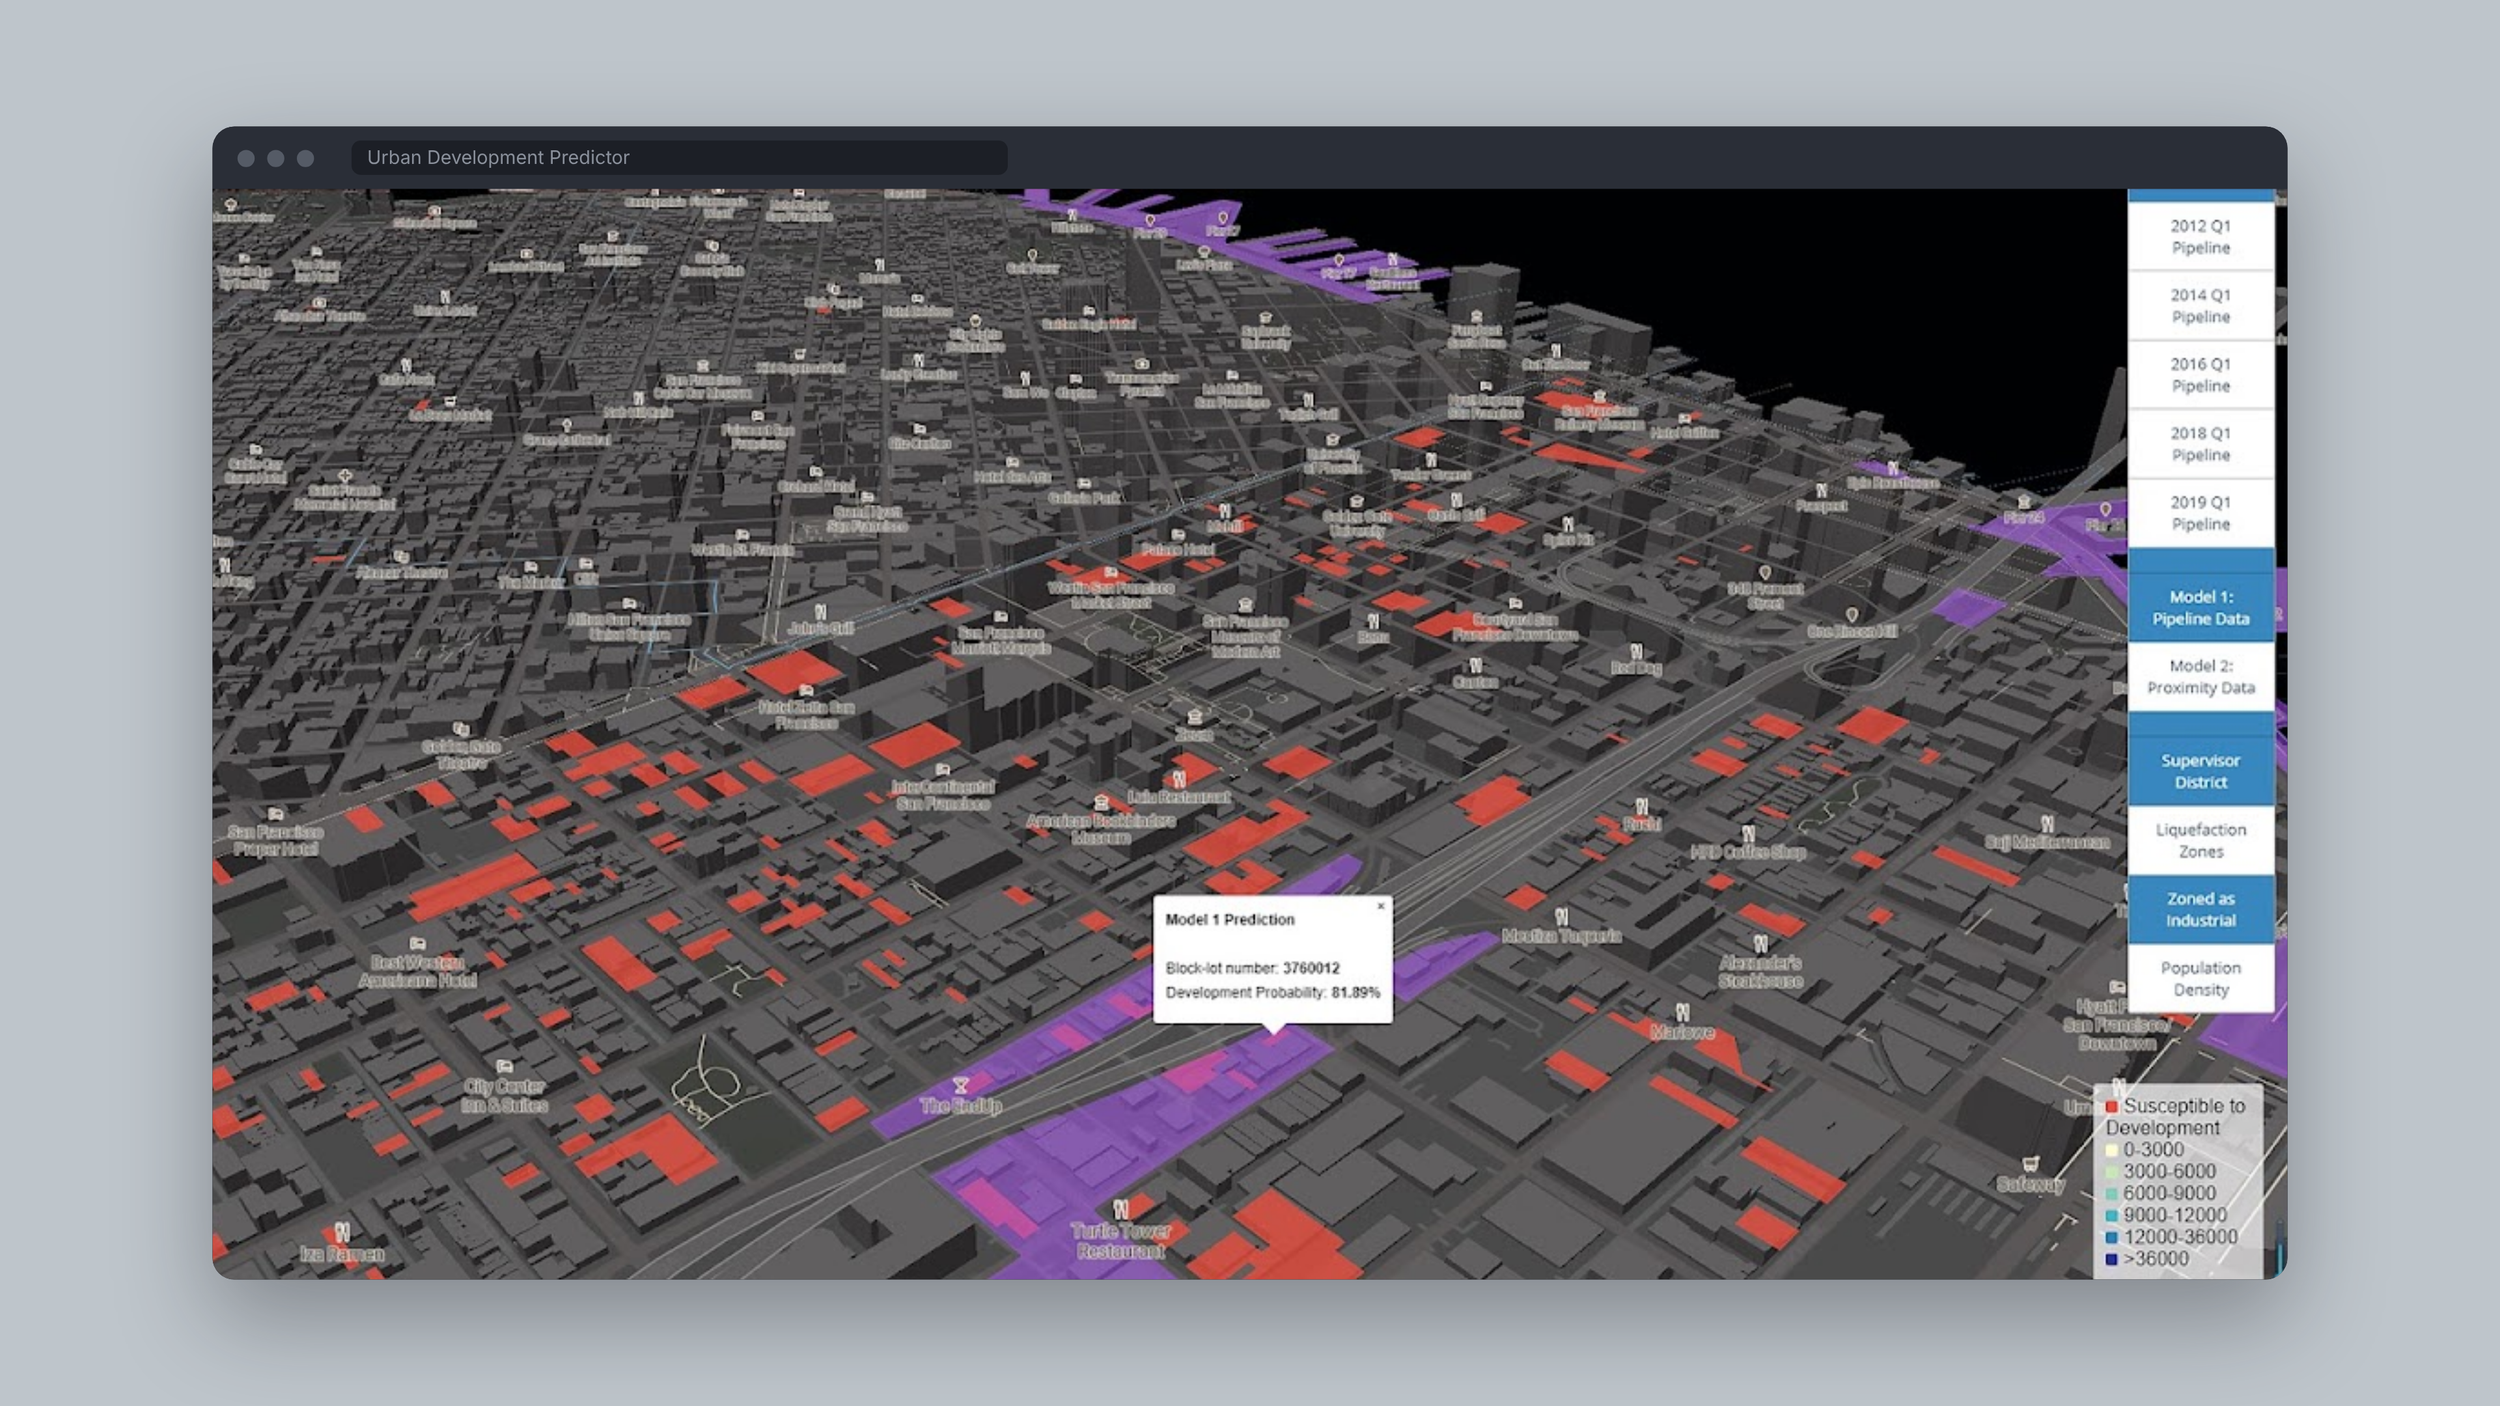
San Francisco’s changing urban fabric has sparked debate over how to plan for continued growth. This research contributes three machine learning models that predict, property by property, the city’s susceptibility to future development: one trained on open data, one with proximity data the team crafted, and one that lets designers adjust the weights to see how the city’s trajectory would change.
Role - Research Advisor & Co-author
Published - The Routledge Companion to Artificial Intelligence in Architecture, 2021
2018 - 2021
Machine Learning at an Urban Scale
The opportunity is the vast and growing repository of open data available to designers. SFOpenData, the most robust public database for the city, became the foundation. The first lesson was that a model is only as good as its data: the design question and the dataset have to be explored together. Growth and development was chosen as the question because it is central to the city’s future and has a deep set of data behind it.
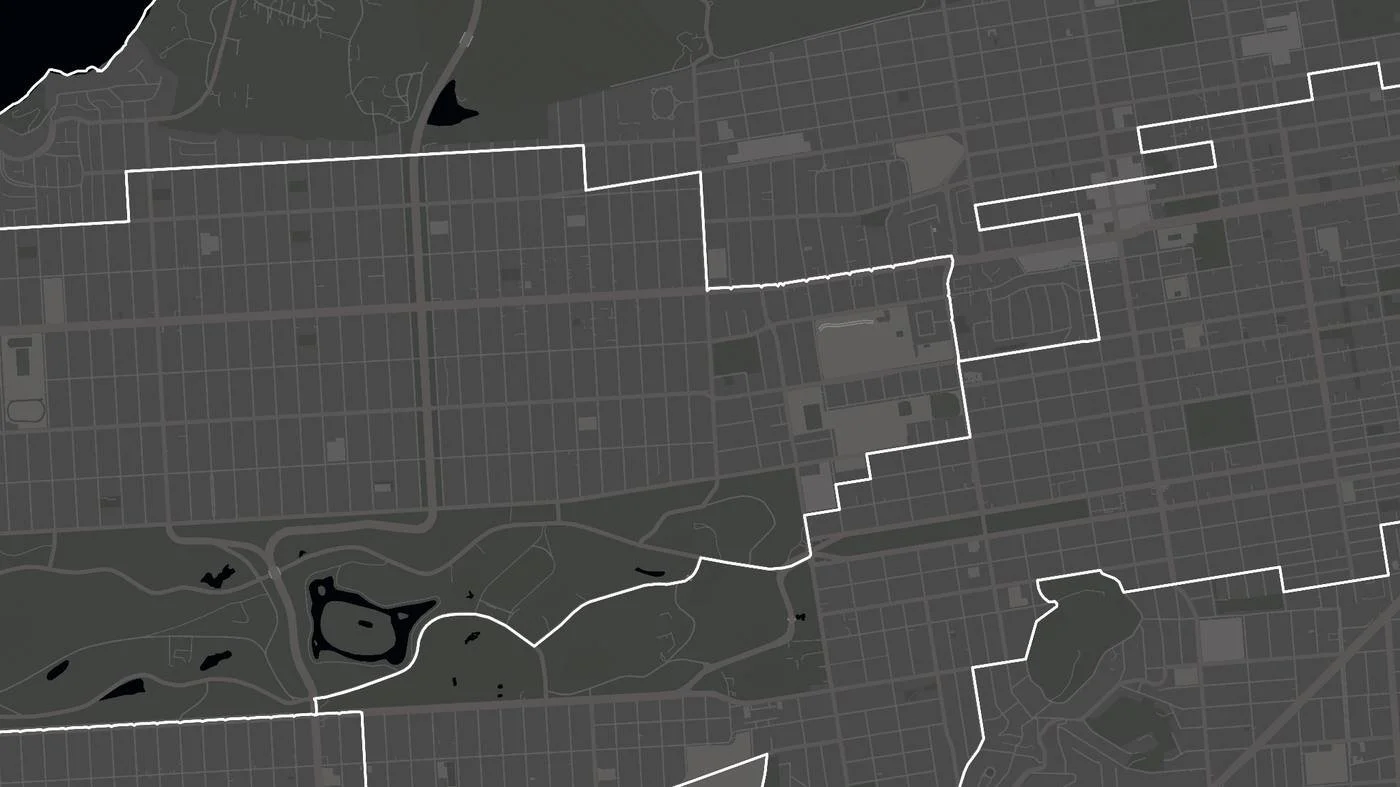
Supervisor Districts
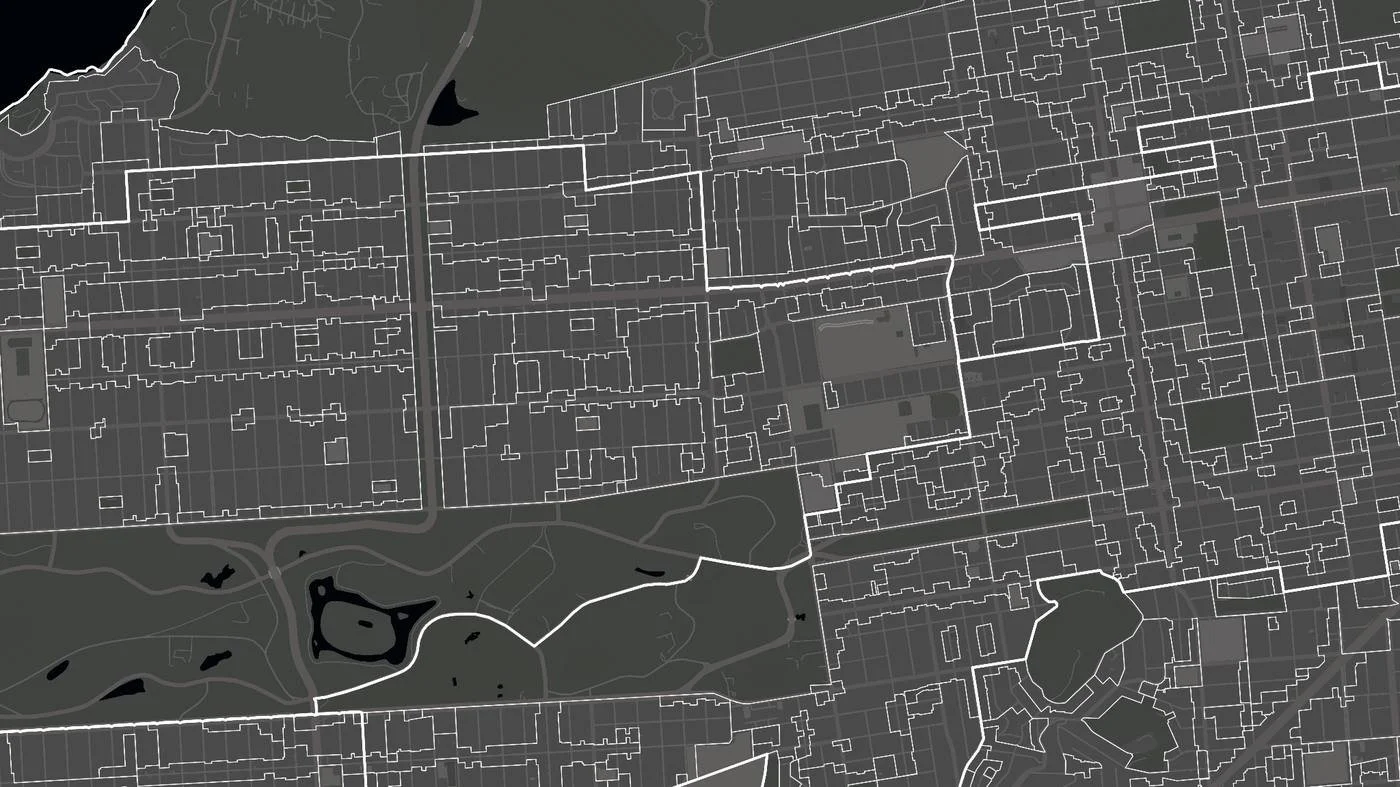
Zoning Districts
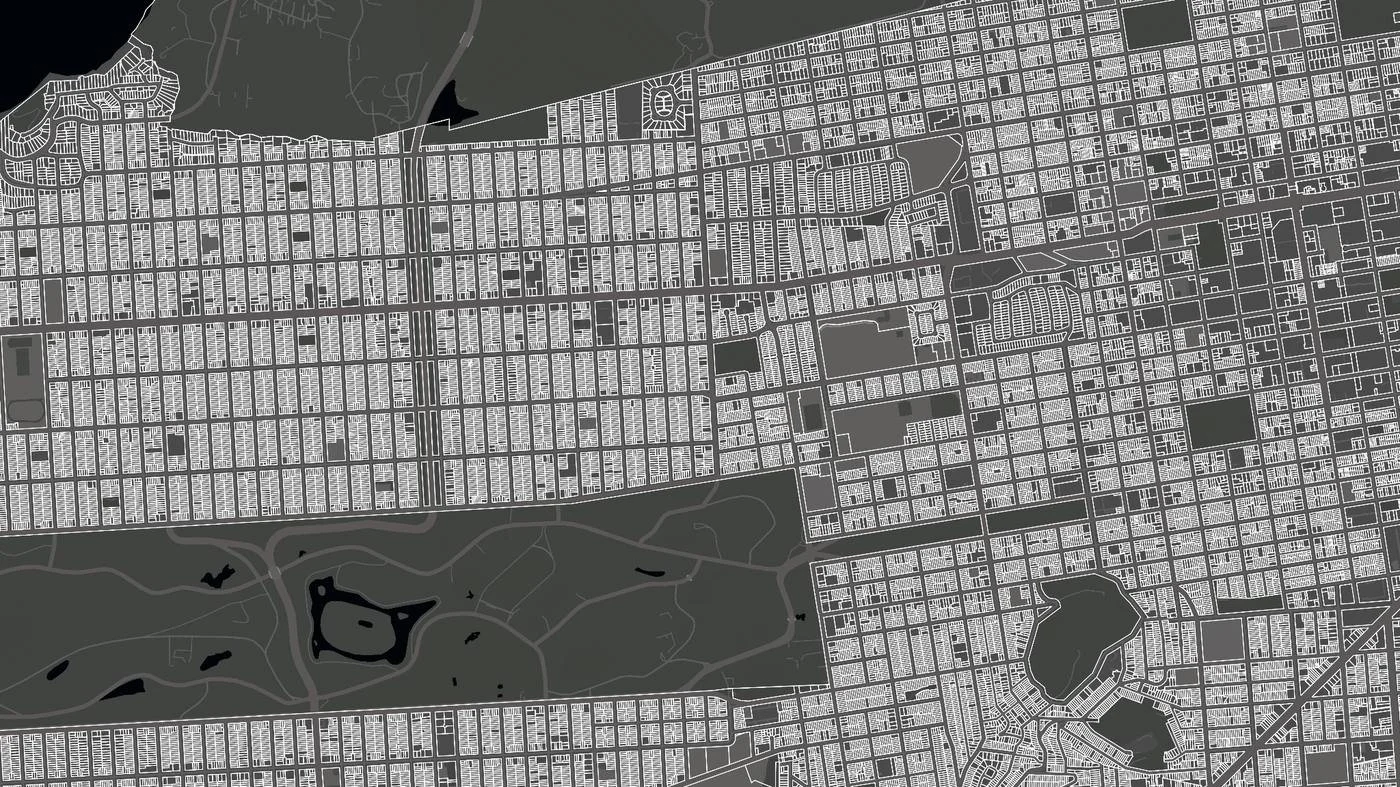
Individual Parcels
Predicting Development in San Francisco
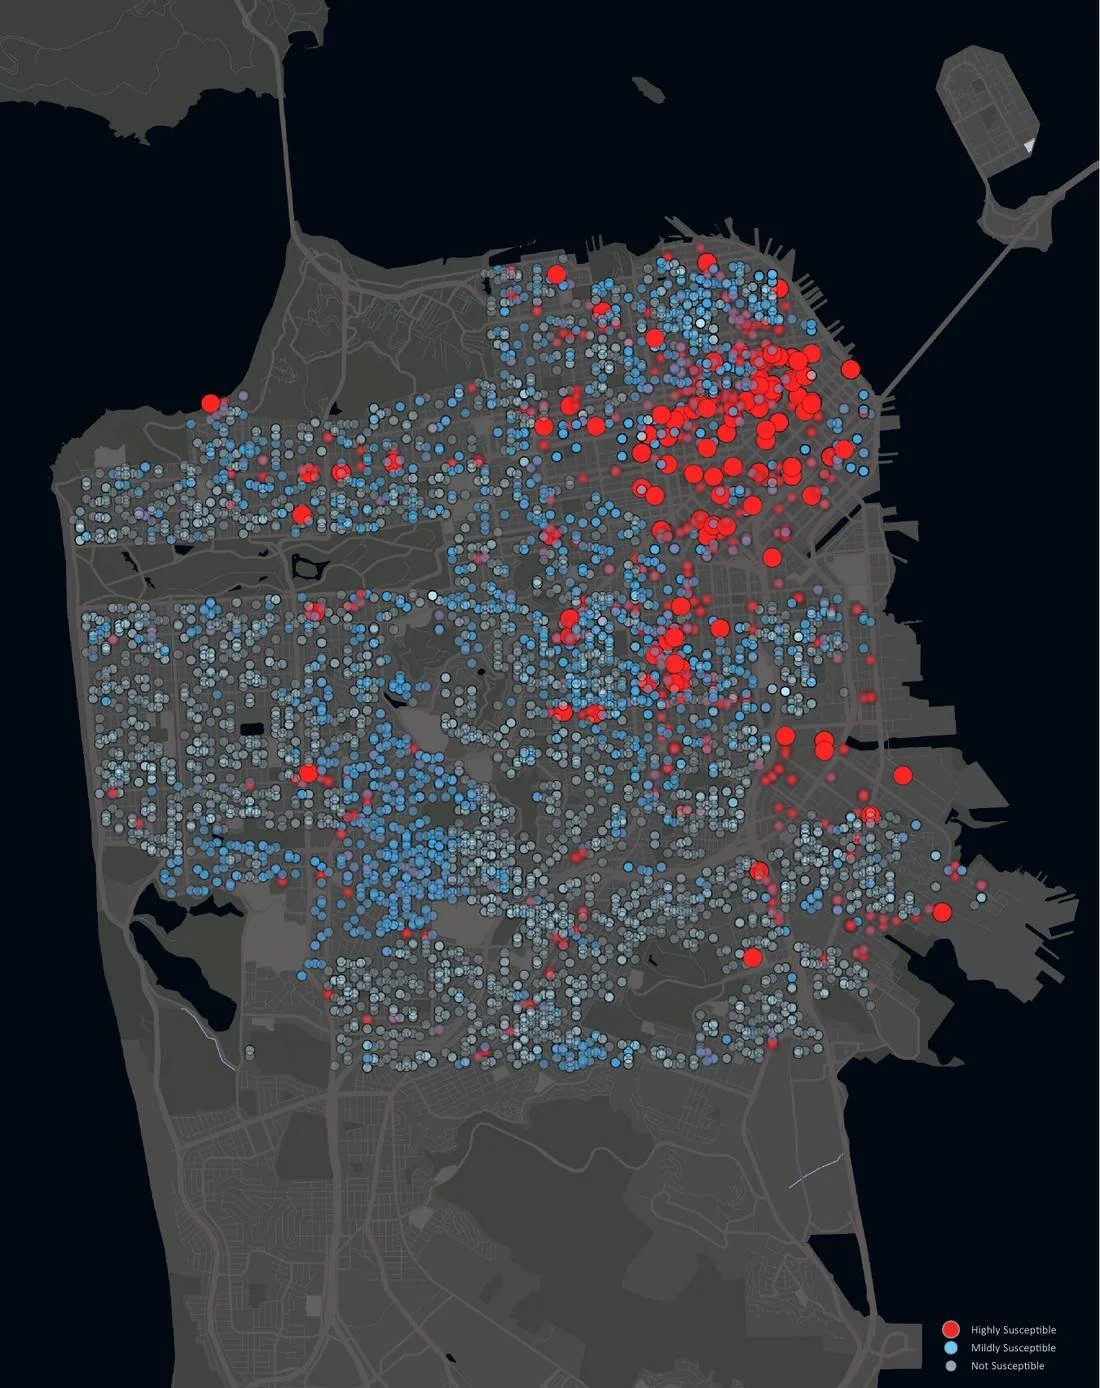
San Francisco’s development pipeline, roughly 10,000 properties submitted for development between 2011 and 2019, defined susceptibility: the likelihood that a property will appear in a future pipeline. The assessor’s block map of 200,000+ properties served as the base, with zoning, seismic and environmental hazards, city operations metrics, census and historic property data layered on top.
Training the Model
Three supervised algorithms were trained on 80% of the data and validated on the remaining 20%.
Logistic regression correctly identified 93.9% of pipeline properties and 89.8% of non-pipeline properties and was chosen for prediction, both for its accuracy and because its coefficients show how much each feature matters.
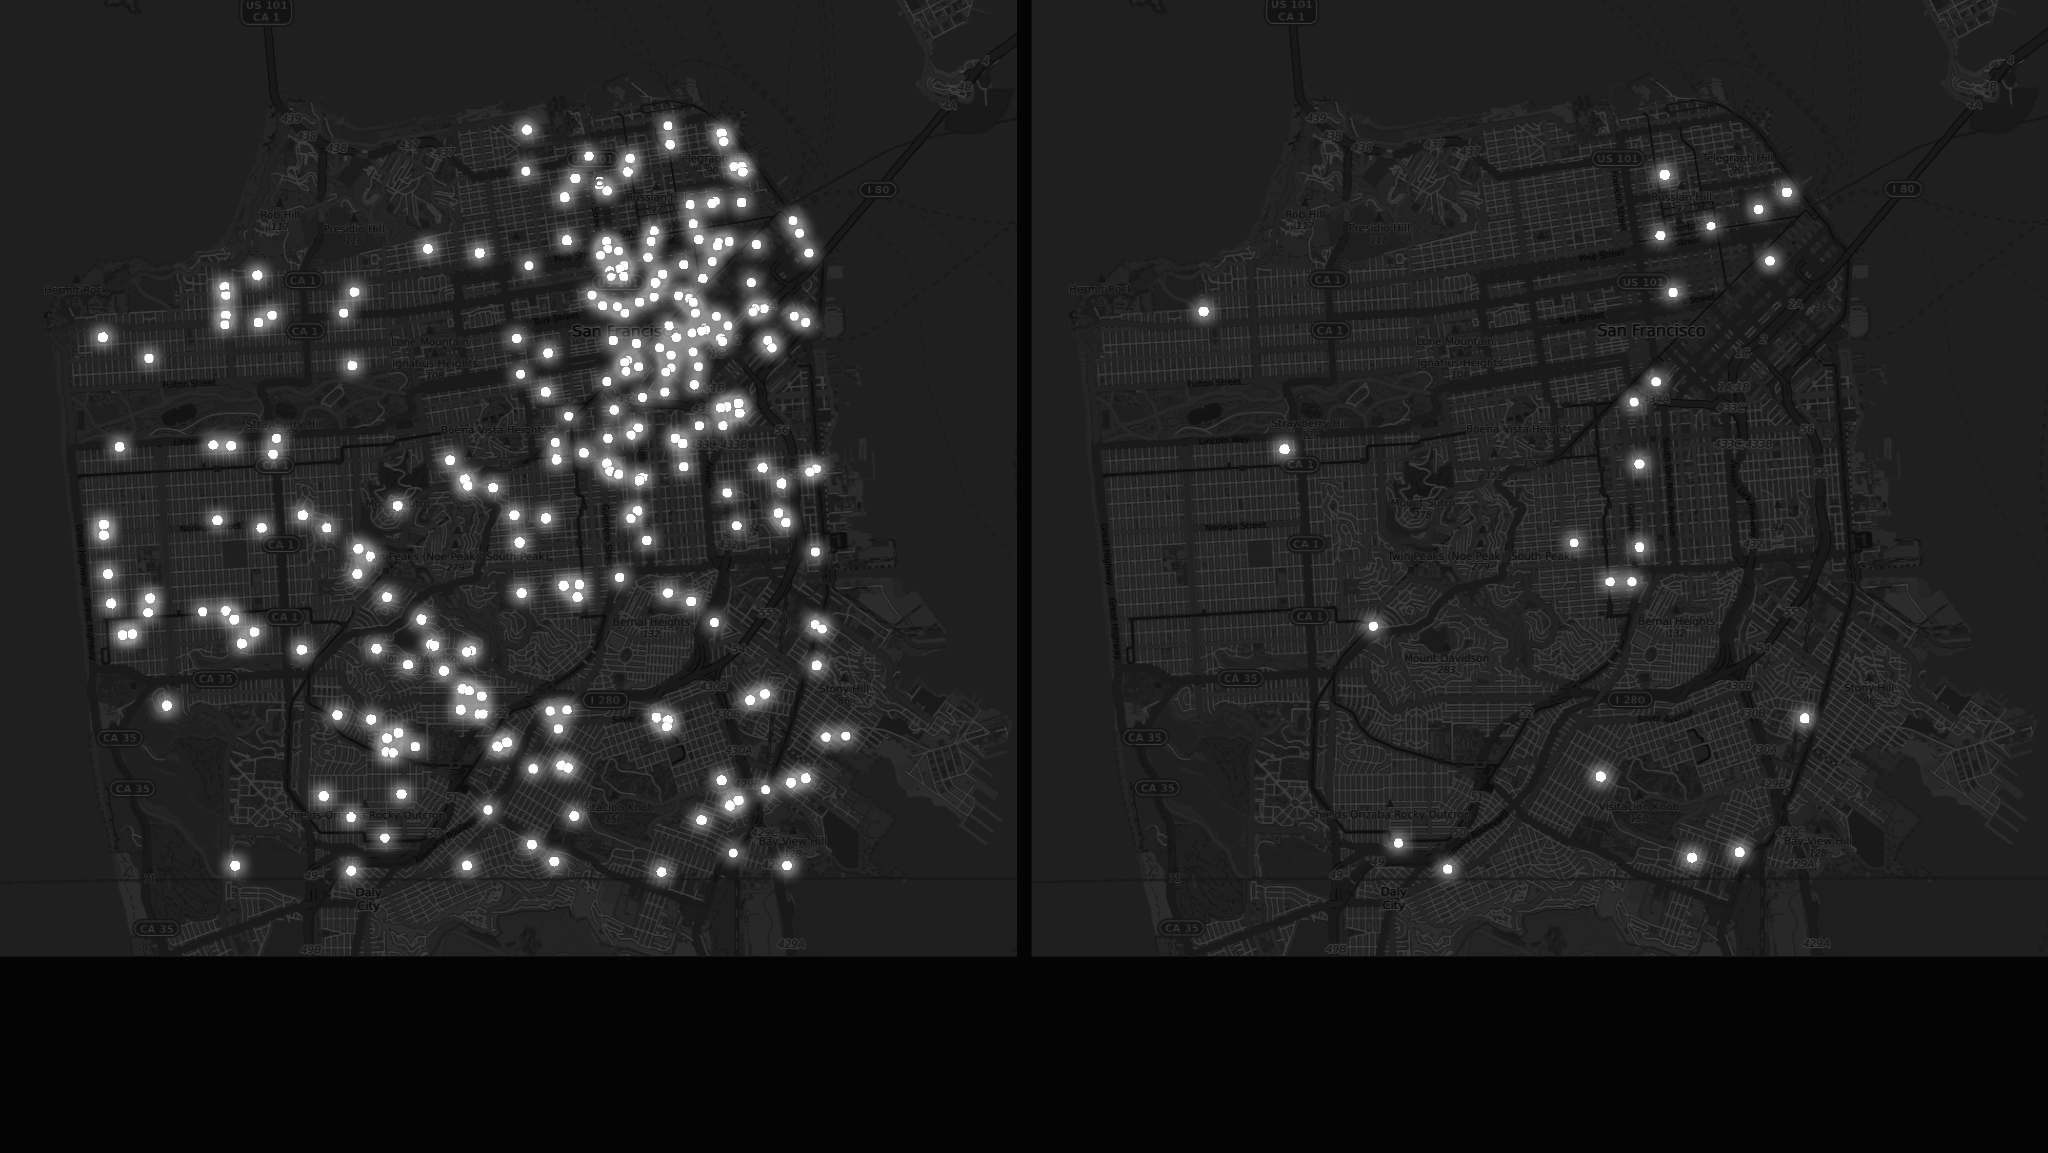
Logistic regression - 93.9% of susceptible properties correctly predicted, 89.8% of not susceptible. Selected for prediction.
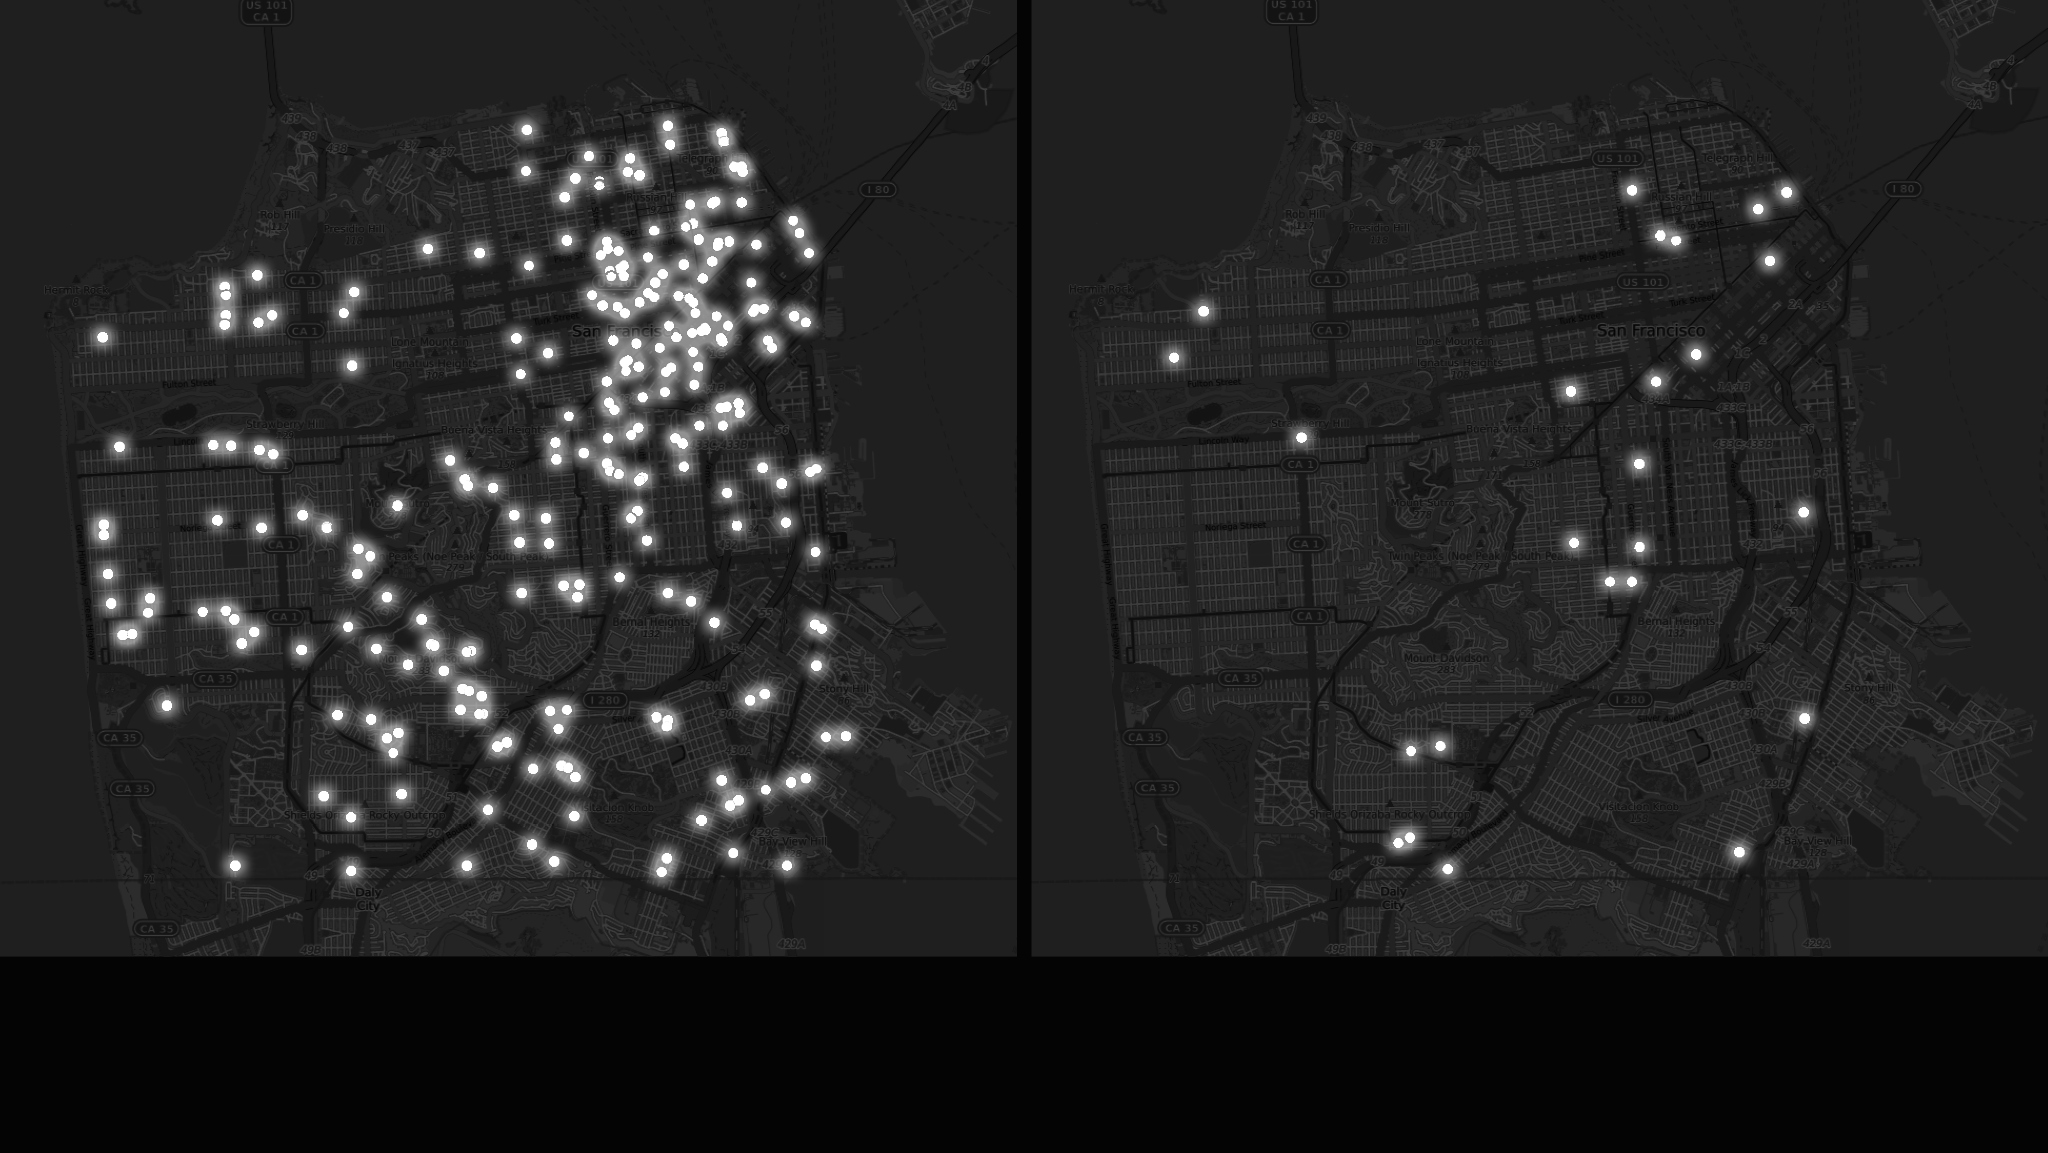
Naive Bayes - 91.8% of susceptible properties correctly predicted, 90.5% of not susceptible.
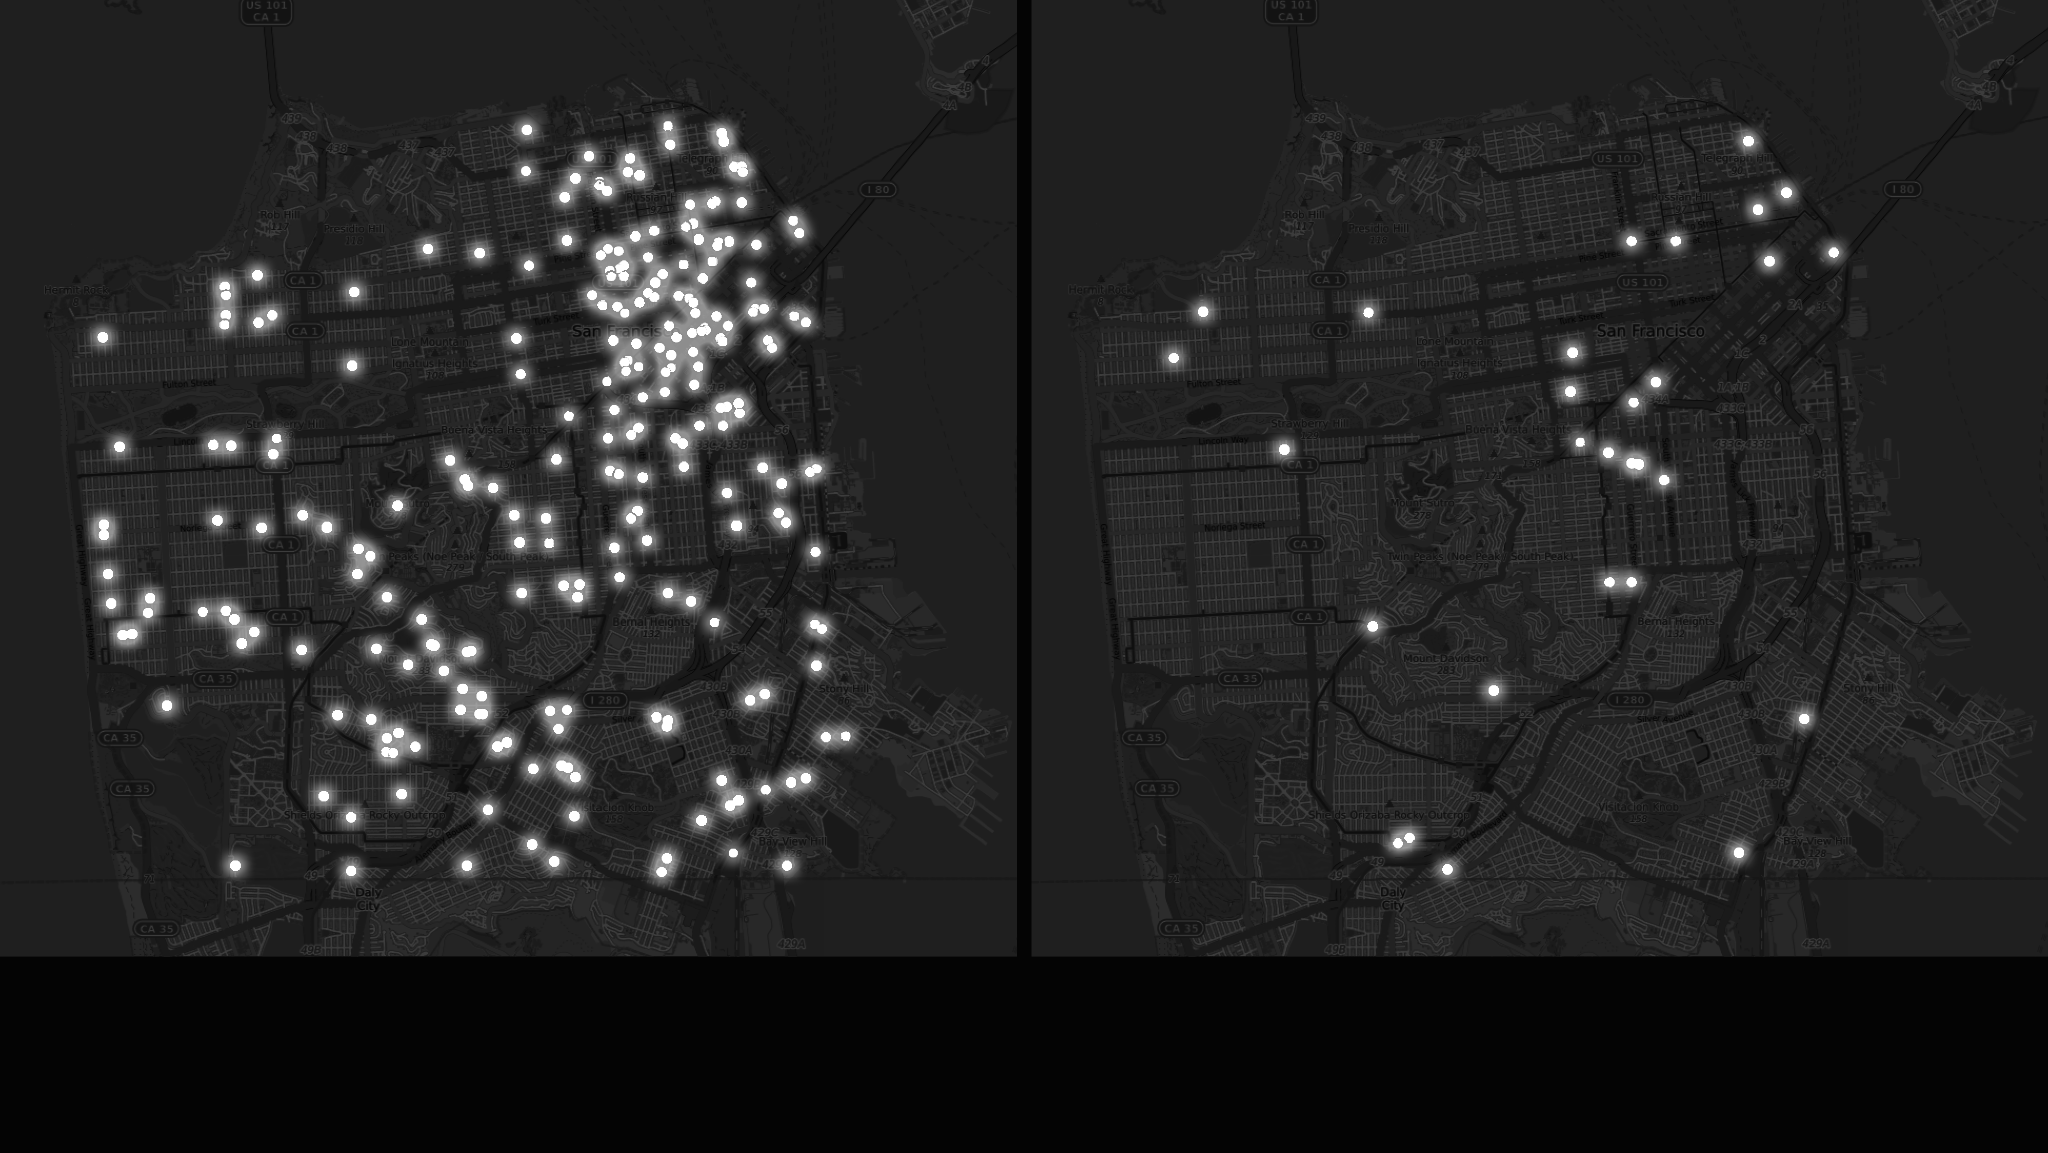
Random forest - 91.8% of susceptible properties correctly predicted, 87.8% of not susceptible.
Prediction 1: An Open-Source Process
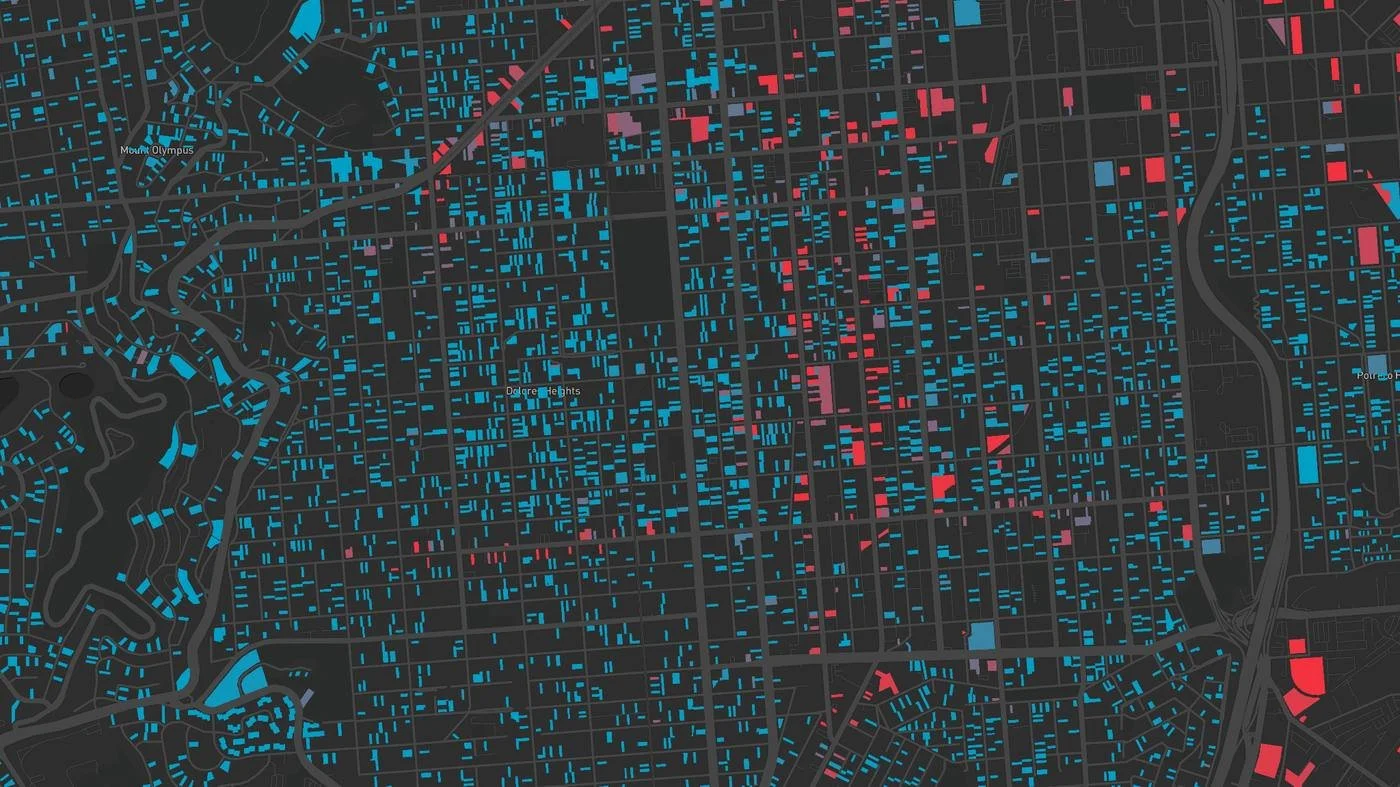
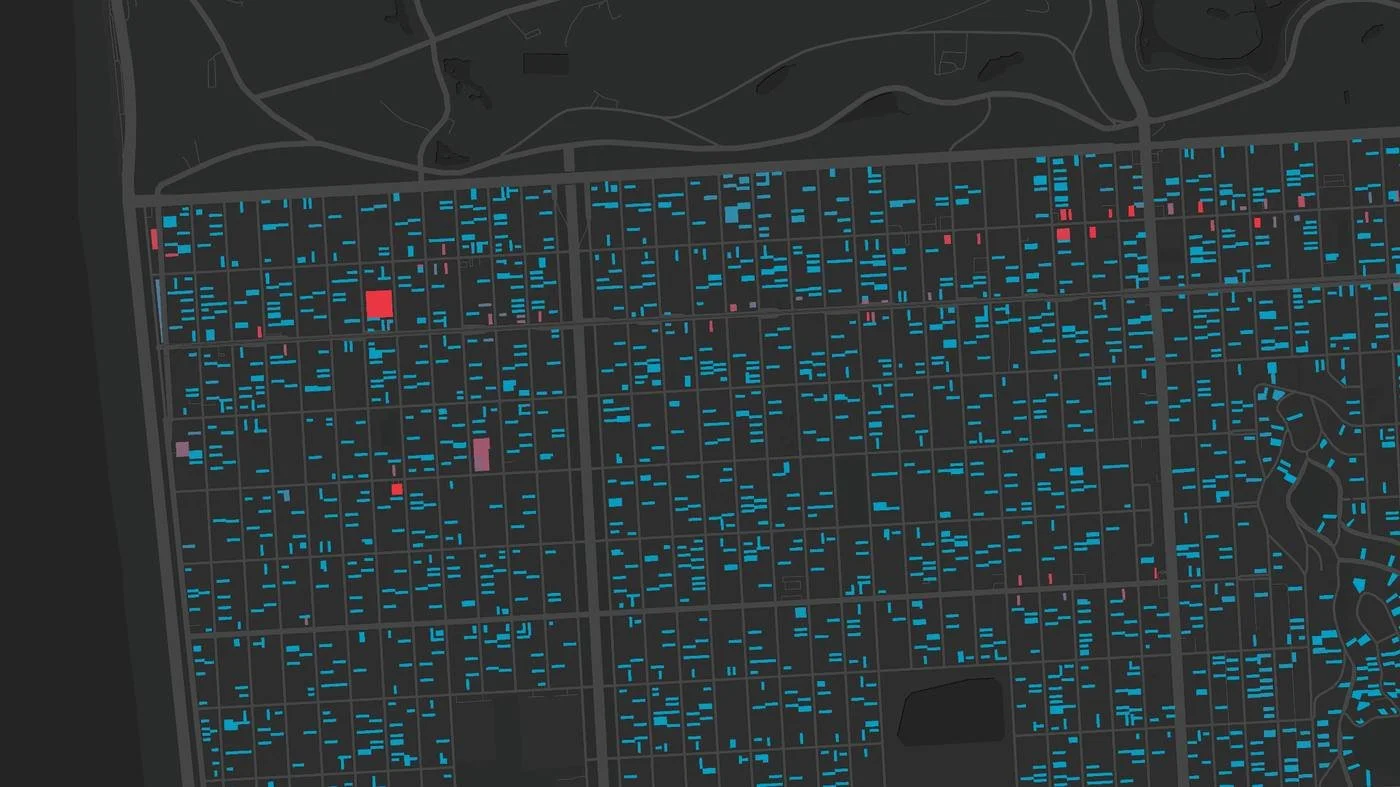
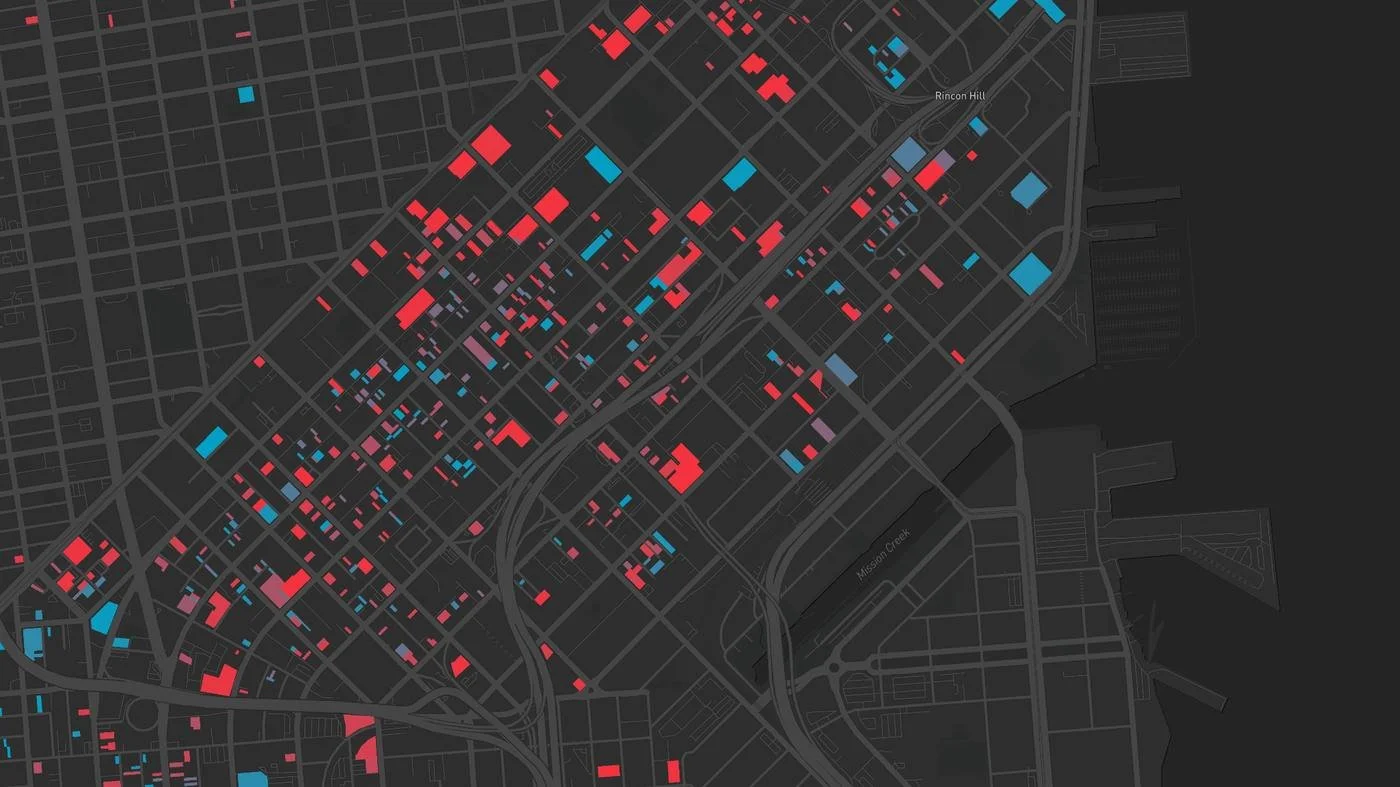
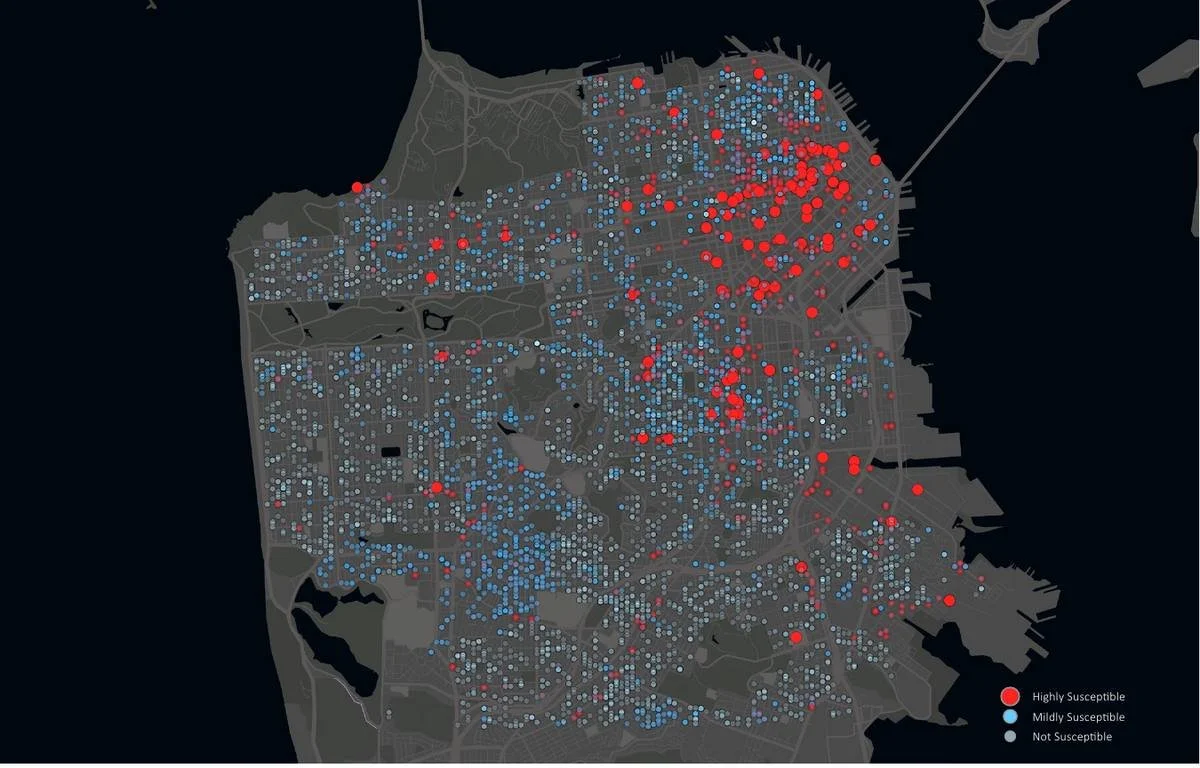
The baseline model scored every property in the city, with the probability scaling each dot on the map. Susceptible parcels clustered where the pipeline already was. Property class, zoning code and parcel area had the strongest influence; building age and number of stories, surprisingly, had little.
Prediction 2: Enhancing the Baseline
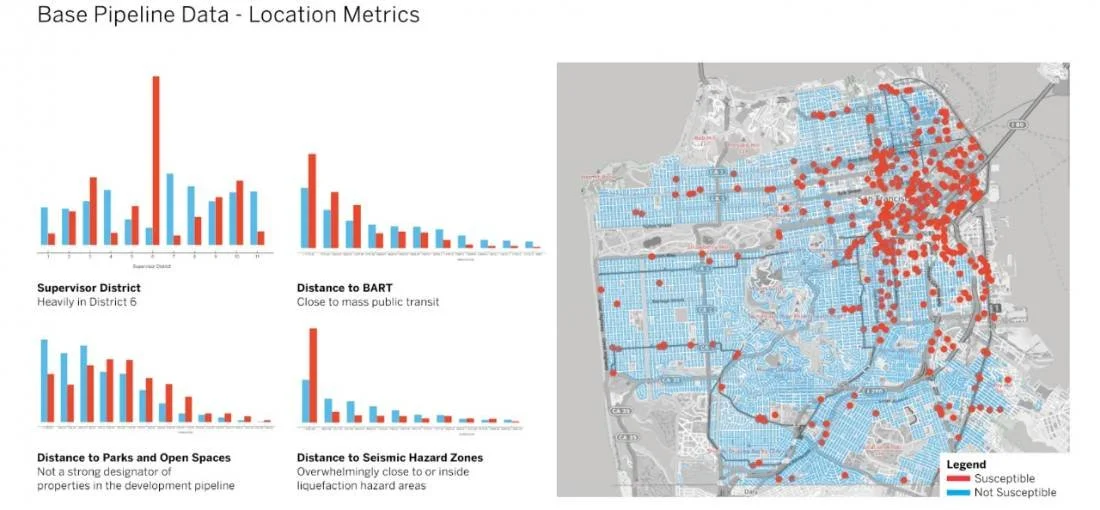
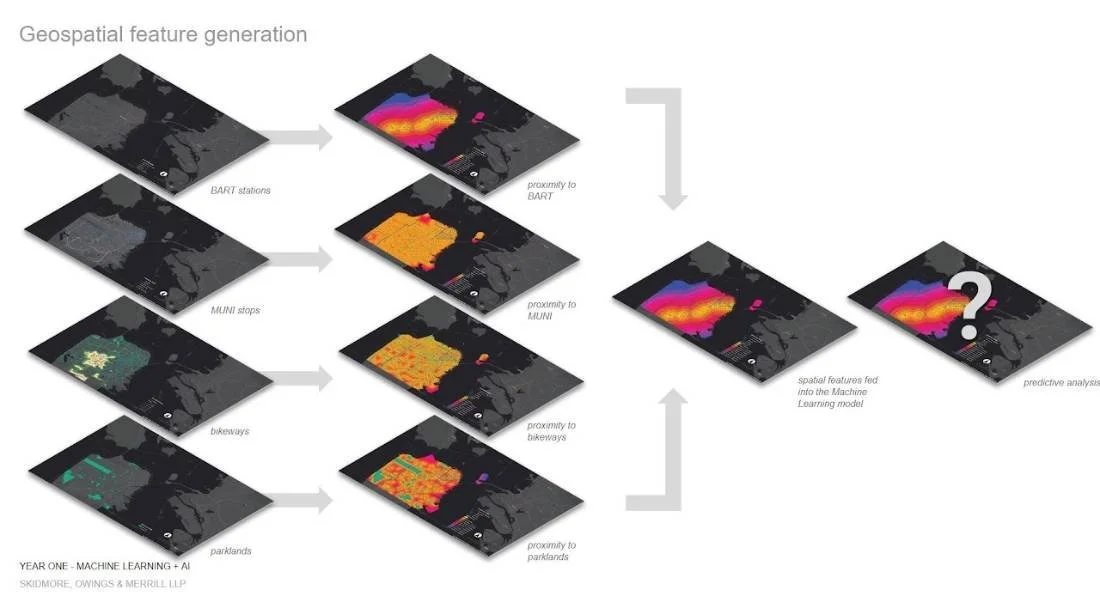
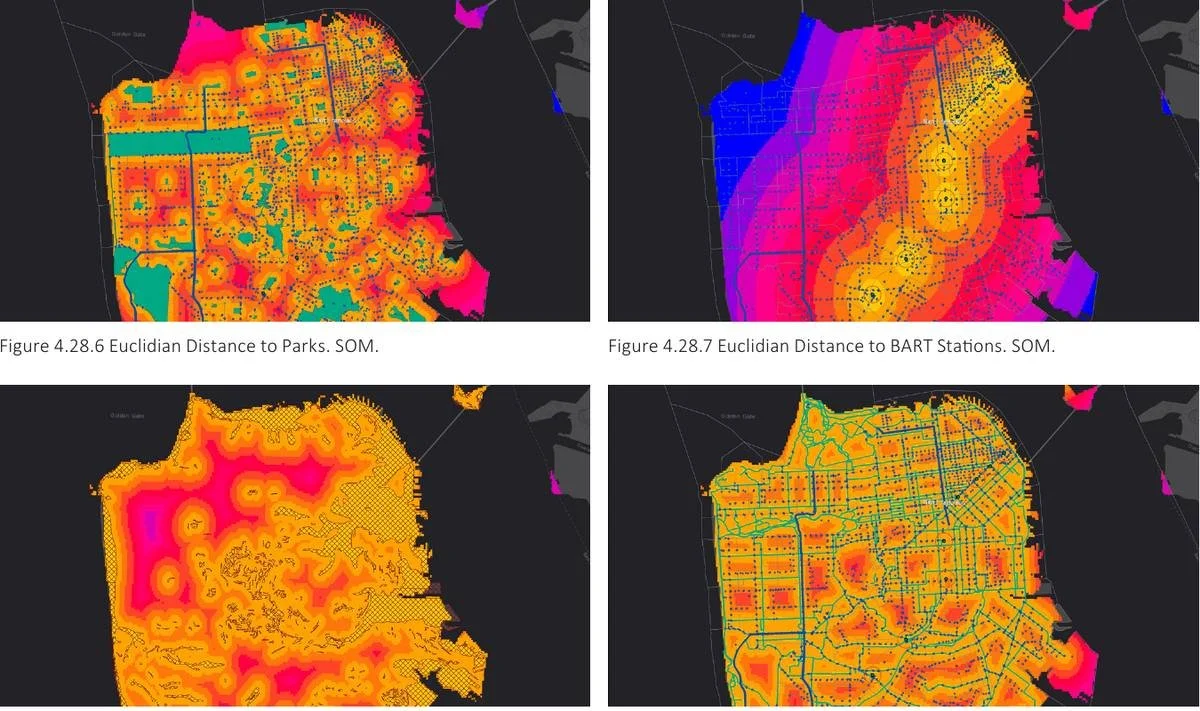
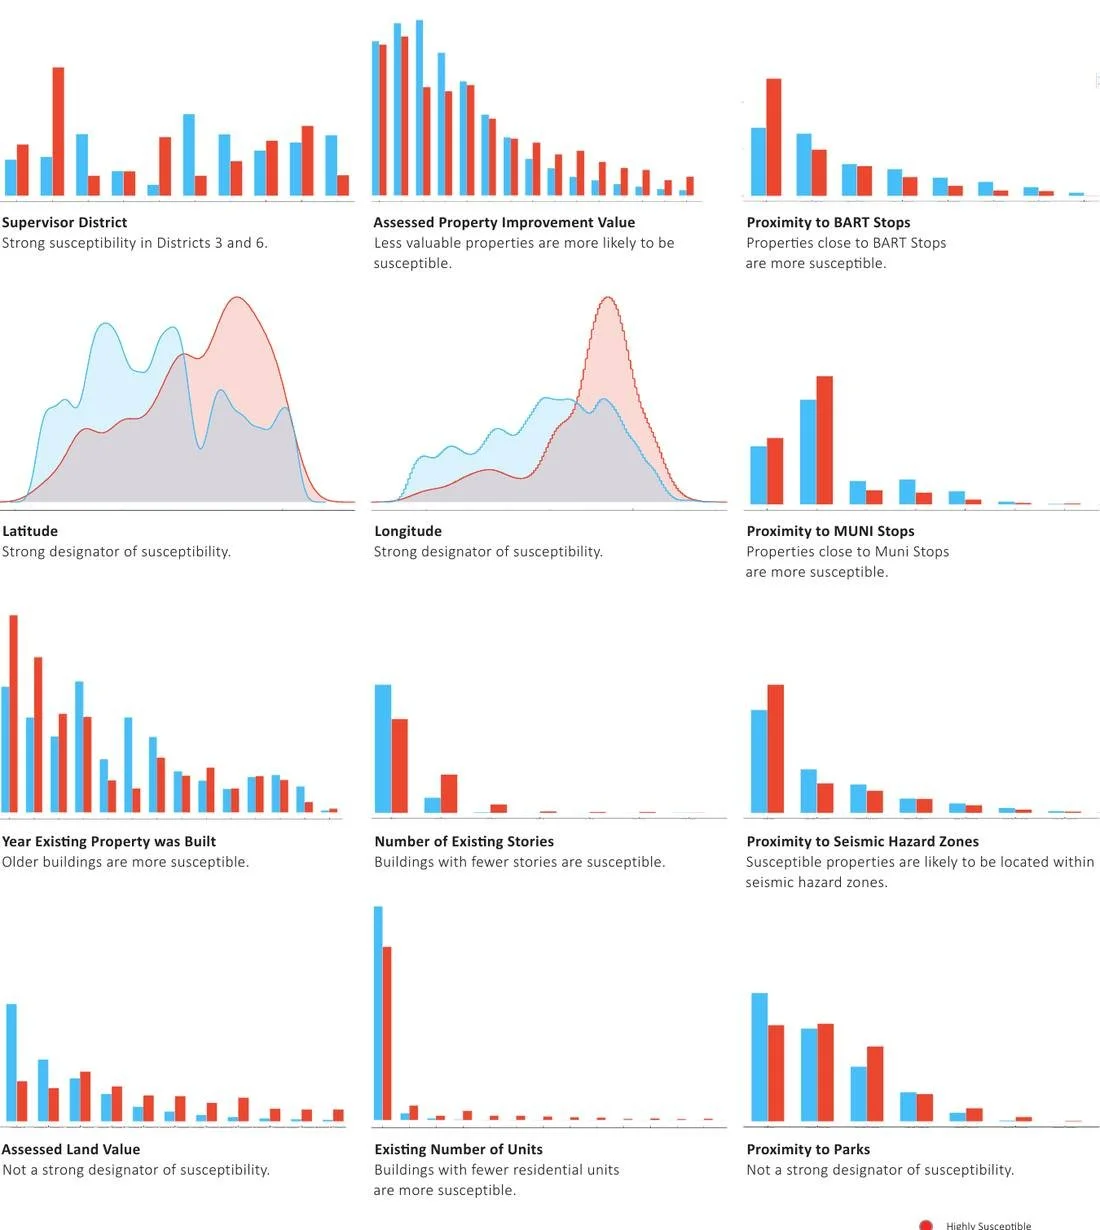
Open data left out what designers consider when planning safer, healthier and more equitable cities. The team added proximity to transit, parks, bikeways and seismic hazard zones and retrained the model.
The broader predictions barely changed, but the new data exposed correlations between the city’s infrastructure and its predicted development, including a strong association between susceptible properties and seismic hazard zones.
Prediction 3: Intervening as Designers
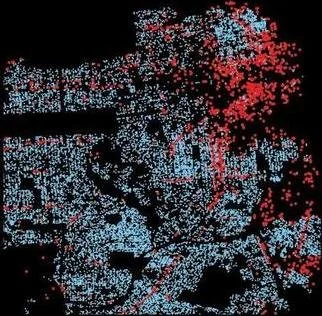
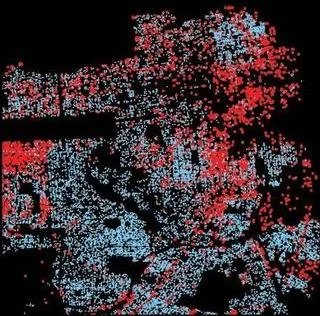
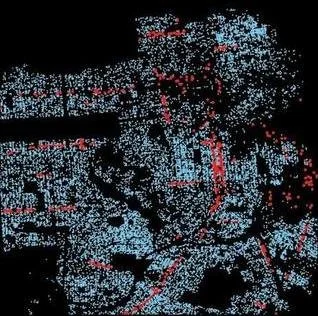
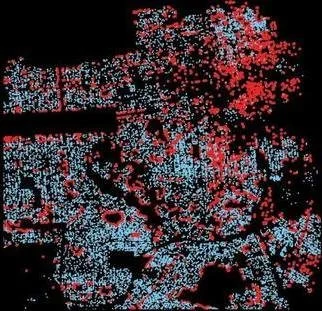
The first two models diagnose the city as it is. The third treats the prediction as a design tool: adjust the weight of each feature toward a desired outcome, such as prioritizing open space, tightening zoning, or limiting development in seismic hazard zones.
These predictions deviated sharply from the first two, and previously low-susceptibility corridors became hot spots, showing how strongly policy shapes the city’s growth.
Original Model
Loose Zoning
Tight Zoning
Tight Open Space and Parks
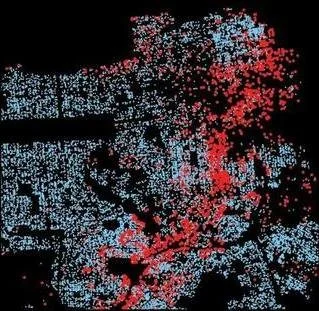
Tight Public Transit
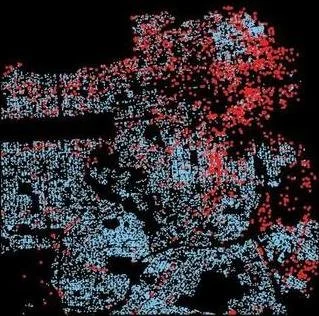
Loose Districts
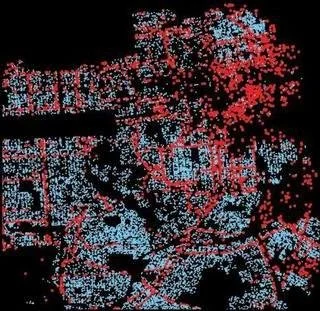
Tight Bike Networks
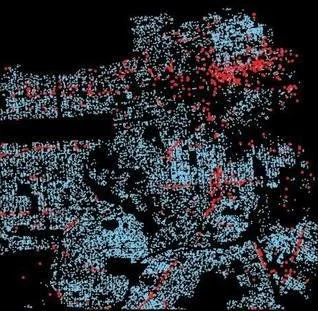
Avoid Seismic Hazard Zones
Findings and Future Opportunities
Developed into an interactive tool, the model would invite designers, developers and policymakers to consider the impact of decisions at the most granular level and to ask which trajectory aligns with a city that is more equitable, resilient, sustainable and healthy. Future work would extend the prediction from where the city changes to what gets built: bulk and massing, area, use and height.
Publication + Talk
This research was published in The Routledge Companion to Artificial Intelligence in Architecture in 2021, and presented at the Chicago Architecture Biennial in 2021.